Sample analysis

Sample Movement Report

2026-05-17  ·  gym.mp4

Movement insights are for training awareness, not medical diagnosis.

Video outputs

Your video created three outputs.

Needs Review
Video data Joint points, masks, timing, alignment
Movement estimates Stress areas, foot angle, posture patterns
Feature 01 · 3D body mesh
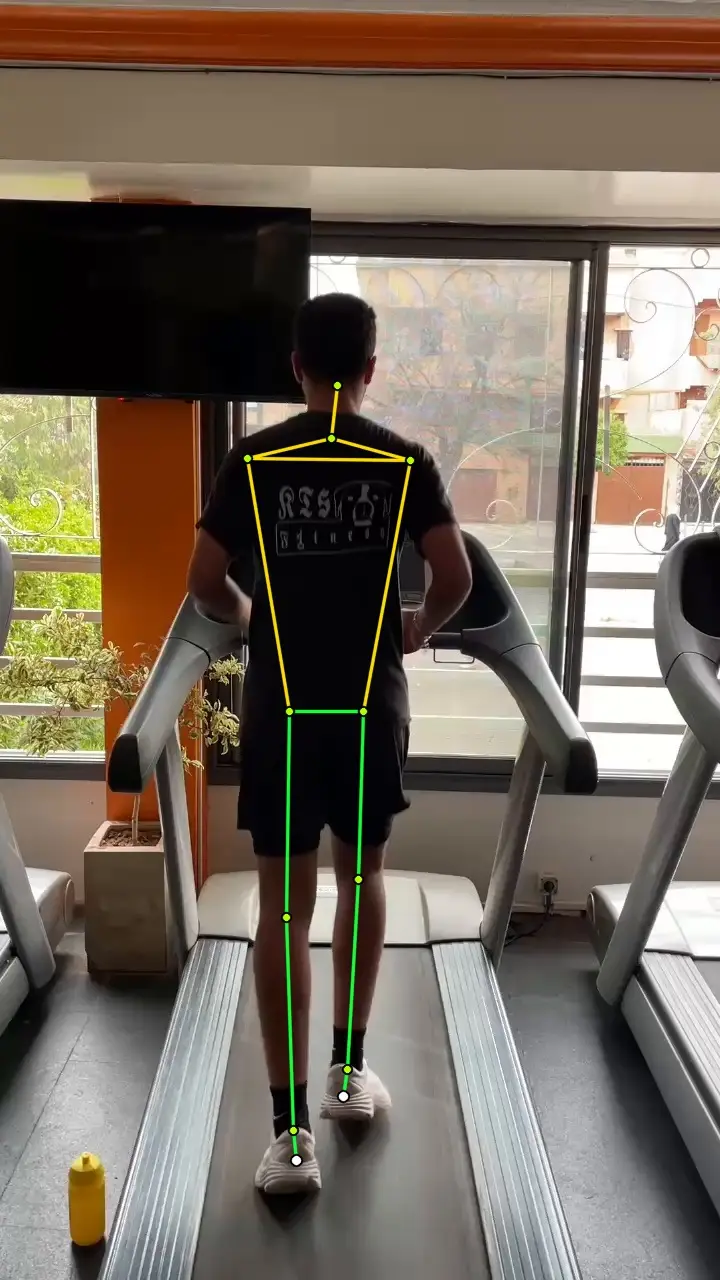
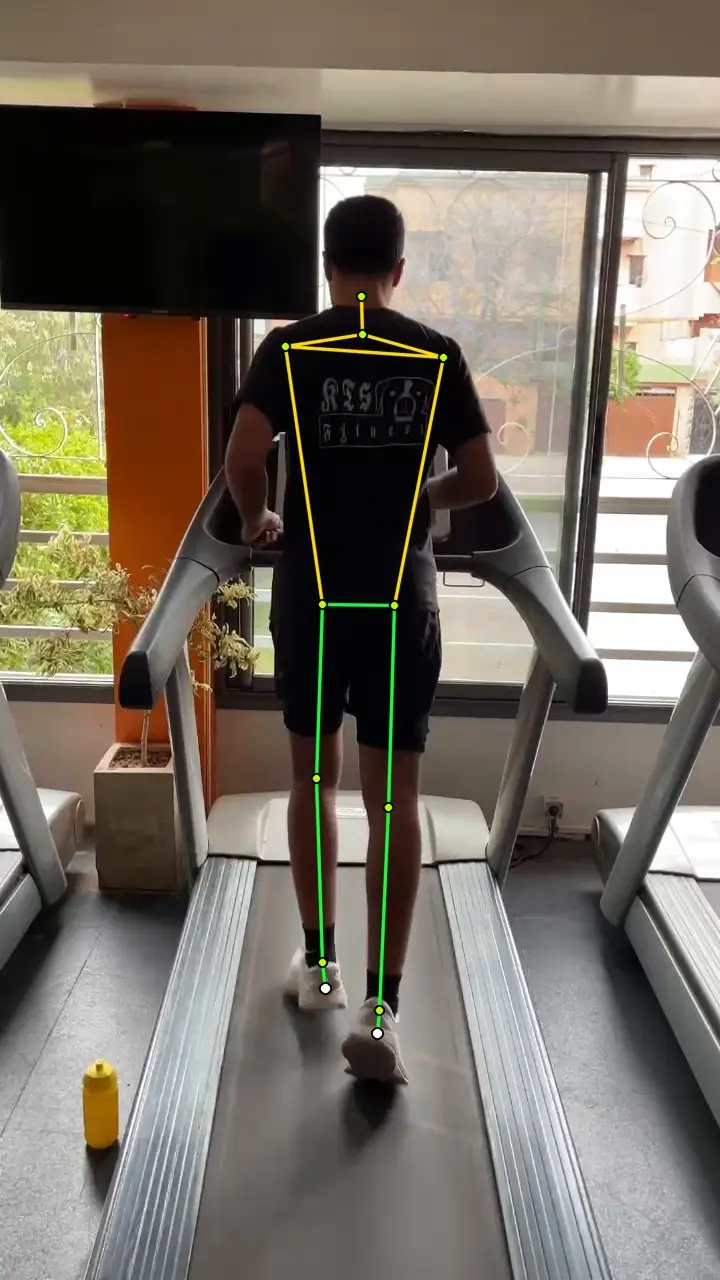
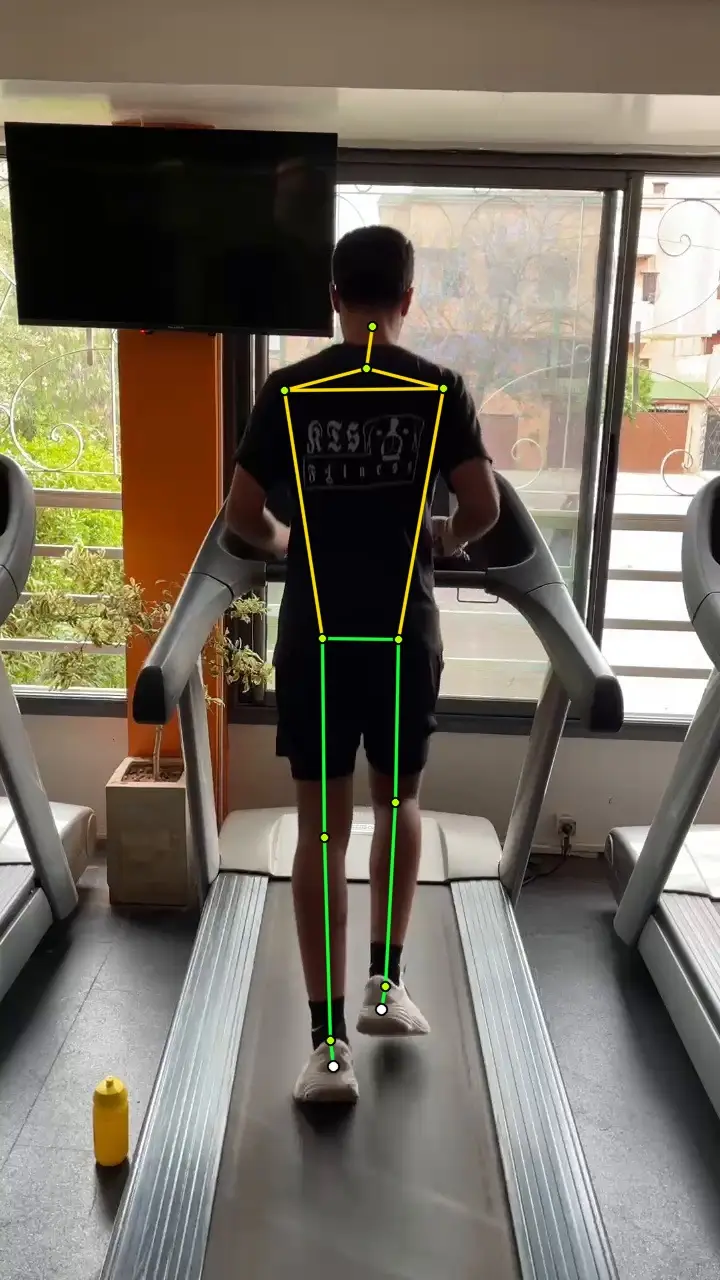
3D body view

Red joint segments mark the highest estimated stress areas for this run.

Personalized Load Proxy High confidence
Main finding Left Ankle

Highest estimated stress area in this run.

Estimated load proxy 32%

Relative 0-100 score for the highlighted body area.

The highest relative mesh load-proxy region is left ankle (low), scaled by body context, speed, incline, surface, and tracked lower-body motion.

What we saw

Left Ankle is the highest estimated stress area in this run.

Why it matters

Repeated stress in one area can show where form may need attention.

Check next

Compare this with the skeleton overlay, then test a simple cadence, posture, or landing cue.

Left Ankle 32% Estimated load proxy
Right Ankle 32% Estimated load proxy
Left Calf 30% Estimated load proxy
Mass
64.0 kg
Pace
7:30 min/km
Surface
Treadmill
Camera
Rear
Feature 02 · Keypoints

Skeleton overlay

Overlay interpretation High confidence

The overlay turns the skeleton track into running signals: cadence, ground-contact balance, and rear-view foot angle class.

What we saw

Stride rhythm, contact balance, and heel angle are estimated from the skeleton track.

Why it matters

Uneven timing or foot angle can be the first clear clue that one side is moving differently.

Check next

Look across many steps, not one frame.

Cadence 93 spm 17 contact events
Ground contact time Left 181 ms / Right 230 ms 50 ms asymmetry
Pronation proxy Left -18.8° / Right -17.4° 1.4° asymmetry
Pronation interpretation 1.4 deg side difference
High confidence

Both sides trend outward during stance in this heel-to-ankle proxy, with low side-to-side difference.

Left -18.8 deg
Outward
Inward
Supinated proxy
Outward heel tilt during stance. 26 stance samples.
Right -17.4 deg
Outward
Inward
Supinated proxy
Outward heel tilt during stance. 29 stance samples.
Negative values mean the heel marker sits outward relative to the ankle-knee line; positive values mean it trends inward.
Feature 03 · Segmentation

Body mask tracking

Segmentation interpretation Mild posture drift
High confidence

Continuous body outline across 133/133 sampled frames. Mild posture drift based on body outline stability and torso keypoint alignment.

What we saw

The mask tracks the runner outline over time.

Why it matters

It helps confirm the system is reading the athlete, not the background.

Check next

Confirm the full body and both feet stay visible.

Mask continuity 100% Continuous body outline
Posture proxy Mild Drift 1.4° trunk lean
Silhouette stability 52% 14.6% body-height sway
The runner outline shows a moderate lean or sway pattern over time.
Multiple People Segmented Review Primary Runner

Frame samples

Frame sample · 0
Skeleton preview frame
Frame sample · 330
Skeleton preview frame
Frame sample · 659
Skeleton preview frame